IdN v30.1: Pop Graphics, Cult & Icons
Release date: August 28, 2025
IdN caters for digital content creators and those who dig the Image. Gathering an impressive following from all corners of the globe, the mag has been heralded as the essential resource or those working or studying within the world of design, and it’s not hard to see why. The newest releases in design technology make this a valuable destination for your software, media and design needs.
In this issue:
Display + Decorative Typefaces & Lettering Too — Time to Display
In the decorative and display typeface world, it seems that size really does matter; even if it looks perfect on the screen, you still cannot be sure that this perfection will pertain when it is enlarged and it may jar somewhat when put side by side with different kinds of typeface. Designers need to pair them with all other types, and in different sizes, just to make sure they will make a perfect pair no matter what size they are in.
In this issue, we have gathered 34 contributors with extensive experience of making decorative and display type, and who have been generous enough to share their tips with us.
Featuring:
Symbols That Define Generations: How Image Makers Shape Our Obsessions
Pop culture is like a chameleon, constantly reshaping itself to mirror the zeitgeist of its era. This cultural phenomenon is not only diverse but also varies significantly across different countries and generations, often functioning as a reflection of youthful spirit, their celebrated figures, and their fervent obsessions. But what exactly delineates “Pop”? To be classified as pop, something must strike a balance between widespread recognition, appealing to the masses, and a certain edginess that resonates with the more rebellious segments of society.
At its foundation, pop culture is driven by a select group of innovators, trailblazers and visionaries who dare to push the boundaries and craft what will ultimately captivate the broader audience. In this issue, we delve deeply into the dynamic and continually evolving landscape of contemporary pop culture. We spotlight 26 artists, creators, and visionaries who are at the forefront of defining what will capture the public’s imagination next.
Related products
-
![]() Art - Design - Graphic Design
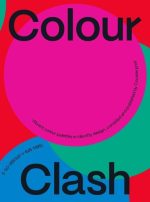
Art - Design - Graphic DesignColour Clash
Colour is one of the essential elements of many branding designs. It can help give an identity personality and warmth, express emotion, communicate messages in an unconscious and subtle way and it can keep or navigate the viewer’s interest, drawing the eye and making elements stand out. This book explores colour palettes in graphic design […]
295 SEK -
![]() Graphic Design
Graphic DesignSans In Use
Showcasing creative pairings and ingenious applications of Serif and Sans Serif typefaces as well as a rich selection of type specimen, Sans in Use and Serif in Use act as a reference point to inspire type designers and type lovers alike. In the world of typography, it is not uncommon to see combinations of serif and sans serif typefaces […]
579 SEK -
![]()
 Graphic Design
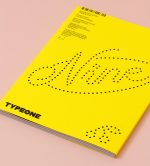
TYPEONE Magazine 09 – Packaging, Food and Typography
TYPEONE is our new bi-annual magazine that uses creative type mediums as a gateway to explore topics such as culture, business, technology, innovation, and design. All these explorations lead by our TYPE01 team and network of freelancers discuss global initiatives, projects, campaigns, and the people behind them — spotlighting the next generation and featuring a […]
295 SEK -
![]() Advertising - Business & Current Affairs - Creative Arts - Graphic Design
Advertising - Business & Current Affairs - Creative Arts - Graphic DesignBranD No.77: The Right Kind of Wrong
A bimonthly English-language magazine tailored for both established and emerging Brand Design professionals around the world……
295 SEK


Top 10 Magazines - July 2025
-

 Acne Paper, Issue 20 – Golden Magazines 550 SEK
 -
 Apartamento, Issue 35 Magazines 245 SEK
 -
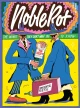
 Noble Rot, Issue 38 Magazines 195 SEK
 -
 The New Era Magazine, Issue 6 Magazines 229 SEK
 -
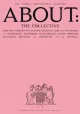 About, Issue 1 Magazines 475 SEK
 -
 Permanent Style, Issue 1 Magazines 379 SEK
 -
 Scenery – Issue 03 Magazines 425 SEK
 -
 Plates, Issue 01 – New Territories Magazines 425 SEK
 -
 L’Étiquette, Issue 14 (English Edition) Magazines 249 SEK
 -
 Never Too Small, Issue 3 Magazines 349 SEK